Tony Duhamel is a roulette computer purchaser who incorrectly applied my computer on videos at home, then claimed me device gave “random” predictions. So I challenged him to conduct live webcam testing of my roulette computer to refute his claims. The test was subject to strict rules to ensure I couldn’t cheat. The results were in my favour, which embarrassed Tony and he has since had a vendetta against me.
About the Public Challenge
Tony claimed that my roulette computer gave “random predictions” if it was used on the same video recorded spin. His logic was the computer couldn’t be accurate if predictions were random. I explained to Tony likely reasons why he would achieve such results and the correct settings to use, but he refused to accept the issue was his misunderstanding of instructions.
I explained to him that if he used the correct settings, then “if you test on the same spin with level settings, and change the reference point, the predictions are mostly within a 3 pocket arc”. This claim was proven TRUE in a public challenge, even with basic settings and intentionally difficult conditions. Tony has tried to hide the results, and refuses a similar test where my computer and Forester’s FFA computer are connected to the same switch to predict simultaneously, to prove which is more accurate (this was done at http://www.roulettecomputers.com/diamond-testing/).
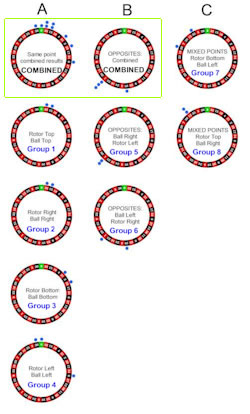
 The actual results are left, and and what they mean is explained below:
For this test, Tony told me which diamonds to use as reference points (for timings) for both the rotor and the ball. He had full control over the reference points I used. For each combination of reference points, I’ve labelled the group in blue text. The two diagrams in the green box show COMBINED for the spins below it. One shows combined results for clocking the rotor at the correct position, and the other shows results for clocking the rotor at the opposite position so they are supposed to have dots on opposite sides.
A simplistic examination of the results would look at only these two charts (in the green box). But the reality is that much more needs to be considered as explained below. But even if we do analyze the results this way, still my claims are proven TRUE as detailed below.
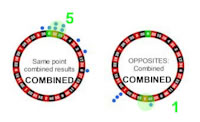
 Shown left are the combined charts with green areas showing 3 pocket arcs. There is a one pocket discrepancy because there are 37 numbers on the wheel, but it is insignificant. Keep in mind my claim which is “if you test on the same spin with level settings, and change the reference point, the predictions are mostly within a 3 pocket arc.”.
Taking into account the opposite reference point for the rotor, the results are that 46% of the dots are within a 3 pocket arc. Is 46% close to 50%? Close enough . . . which is why Tony tried to hide the results.
Now let’s look at a more detailed and more accurate analysis of the results . . .
First you need to understand how the ball decelerates on a real wheel. Click here to download one of the chapters from the roulette computer instructions. Pay particular attention to the part about the curve of deceleration of the ball, and how it is NOT smooth – it is wavey. This means if you use different reference points for the ball on a wheel with even slight tilt, you will find that when doing the different diamond test, using the same diamonds for the ball result in predictions being closer together than they are if you use a different diamond. Therefore is it impossible for the computer to maximize accuracy if you use different diamonds as reference points. After all, the computer will inevitably receive inaccurate or incomplete data. This is FACT. Anyone with good roulette knowledge can verify the reality of the ball’s deceleration curve. Moreover, the results from my test are consistent with this fact which further illustrates the results are legitimate.
 Thorough Analysis of Results:
*Vertical Column A is where I used the same reference point for both the rotor and ball on an individual group, although the reference points were different in each combination. The closer the dots are to each other for each group (combination of reference points), the higher the accuracy. You will notice that most of the time, for each group, the prediction is either the same or easily within 3 pockets of each other.
SUMMARY OF RESULTS:
Group 1: 100% within 3 pocket arc
Group 2: 100% within 3 pocket arc
Group 3: 100% within 3 pocket arc
Group 4: 66% within 3 pocket arc
Group 5: 100% within 3 pocket arc
Group 6: 50% within 3 pocket arc
Group 7: 50% within 3 pocket arc
Group 8: 100% within 3 pocket arc
So are most predictions within a 3 pocket arc? ABSOLUTELY and very easily.
In fact I almost got 100% of predictions within the 3 pocket arc, which would have been a near PERFECT result. Only 2 of 15 predictions were outside the 3 pocket arc. Either way, the list of 100%’s is clear enough.
* Vertical Column B is where I used opposite reference points for the ball and rotor, and thus we expect predictions to be opposite those in Column A.
* Vertical Column C is using reference points that are neither the same for rotor and ball, or opposite for rotor and ball. They are expected to be completely different from Columns A and B. The important point to note is each group has dots still close together. I explained it to Tony, but as usual he did not understand and thought Column C is related to Columns A and B. Forester would have known Tony’s explanation of the results was wrong, but why would he correct him? After all, Tony’s explanation suited Forester who is just as manipulative. I did expect this reaction though. He did the same thing with Viper’s incorrect understanding, but the recording is published for everyone to see for themselves.
Other Important Variables:
It is important to note that the above clearly positive results were achieved in deliberately difficult conditions. See below for details:
- Predictions were made about 13 seconds before the ball fall, so the ball wasn’t exactly slow when clicks were made. Specifically the target ball speed was 800ms (0.8s), which is much faster than the typical 1300ms (1.3s) that predictions are normally made.
- No consideration is given to the fact that we as humans introduce clocking errors when we use different reference points (top, left, bottom, right). This is another reason why using the same reference points resulted in predictions that were very close together.
- The wheel used was the new MK7 Velstone Huxley, where the ball very gradually decelerates. It is important to understand that the quicker the ball decelerates, the more more accurate predictions are. I did not opt to choose an easy wheel. For this new wheel, at the time of prediction in the tests, the difference in timing between one revolution and the next was 92ms. On an average secondhand wheel, it is about 200ms difference between revolutions. This means that considering this point alone, conditions were more than twice as difficult as usual. And still the results were clearly positive.
- The “Risk” feature where my computer rejects spins that the computer considers likely inaccurate was almost completely disabled. So I got all predictions, good and bad. With forester’s FFA testing, so many spins resulted in error being called, and STILL the results from my computer were twice as good (see http://www.roulettecomputers.com/diamond-testing/) – even with predictions a bit earlier than FFA – it’s all on video for you to see. The only time risk was called was when I used the right diamond (as explained in the audio, because it was close to the edges of the ball revolution being learned), or if I did something like missed a click completely.
- So the phone and everything done on it was visible, I did not use a typical clocking switch. Clicks were made directly on the phone. This reduces accuracy because the clicks arent as “sharp” as the normal switch.
- Predictions were made roughly 1 second before FFA is even capable of giving. The predictions were made when the ball speed was about 800ms per revolution. FFA has three settings that define the time/speed window that it locks on to. The fastest setting on FFA for level wheel prediction is 1000ms. Why? Because if predictions are made when the ball is any faster, and you will have significantly reduced accuracy for clocking.
- Notice how on some of the diamond/ball reference point combinations have predictions “spot on” right in the same pocket? Tony was rather quiet after such spins. But he jumped up and down like a fool when 2 particular predictions were a bit wider than the others which mostly varied by no more than 1-3 pockets.
Summary:
Again my claim was “if you test on the same spin with level settings, and change the reference point, the predictions are mostly within a 3 pocket arc.”
Did I prove this?
If you take a simplistic analysis, without consideration to the difficulty of the conditions I created myself for the test, the result was than 46% of the predictions were within a 3 pocket arc. Close enough to 50? You decide.
As for the detailed analysis considering all variables and intentionally difficult conditions to prove my point, the results were:
Group 1: 100% within 3 pocket arc
Group 2: 100% within 3 pocket arc
Group 3: 100% within 3 pocket arc
Group 4: 66% within 3 pocket arc
Group 5: 100% within 3 pocket arc
Group 6: 50% within 3 pocket arc
Group 7: 50% within 3 pocket arc
Group 8: 100% within 3 pocket arc
Certainly well over 50%, and not far off 100%.
If you understand everything here, you will be in no doubt that Tony has been misleading people. He has made numerous other false claims that are petty. I have only bothered to thoroughly address the most relevant false claims. While Tony is unprepared to admit his mistake, you can review everything and decide for yourself.